Susan Laitsch
April 8, 2019
Introduction
The Apalachicola-Chattahoochee-Flint River basin (ACF) extends through Georgia, southeastern Alabama, and northwestern Florida and covers an area of 19,600 miles (Florida Department of Environmental Protection). The Apalachicola River basin is a small subsection of this larger system with the Florida portion covering roughly 2,727 square miles (Coach et. al., 1996). The ACF originates in northern Georgia with the Chattahoochee River which is joined downstream on the Florida Georgia border with the Flint river. The Flit-Chattahoochee confluence is also the location of Lake Seminole (formed by the Jim Woodruff Dam) and the head of the Apalachicola River, the largest river in Florida (Lathrop, 2008). Further south, the Apalachicola river is joined by the Chipola River before finally reaching its’ mouth at Apalachicola Bay (Livingston & Joyce, 1977), spanning a total distance of 106 miles (Livingston, 1991). The entire ACF River basin is mapped in Figure 1, below.

Figure 1. Map of ACF River basin showing major boundaries, tributaries, mainstem flows, and position of selected stream-gaging stations (Couch et. al., 1996).
Water quality in the ACF basin depends on 16 mainstem reservoirs, 13 of which are on the Chattahoochee River (Couch et. al., 1996). The system’s groundwater is held in 6 aquifers; the surficial, Floridian, Claiborne, Clayton, Providence, and crystalline-rock aquifers (Couch et. al., 1996). Both the Floridian aquifer system and the surficial aquifer system are located in the coastal plain providence of the Apalachicola River Basin. Many layers of rock, dating from the Miocene – Paleocene, represent the unique strata within the Floridian aquifer. Geologic formations/units for each stratum within these aquifers can be seen in the cross-sectional diagram Figure 1, below.
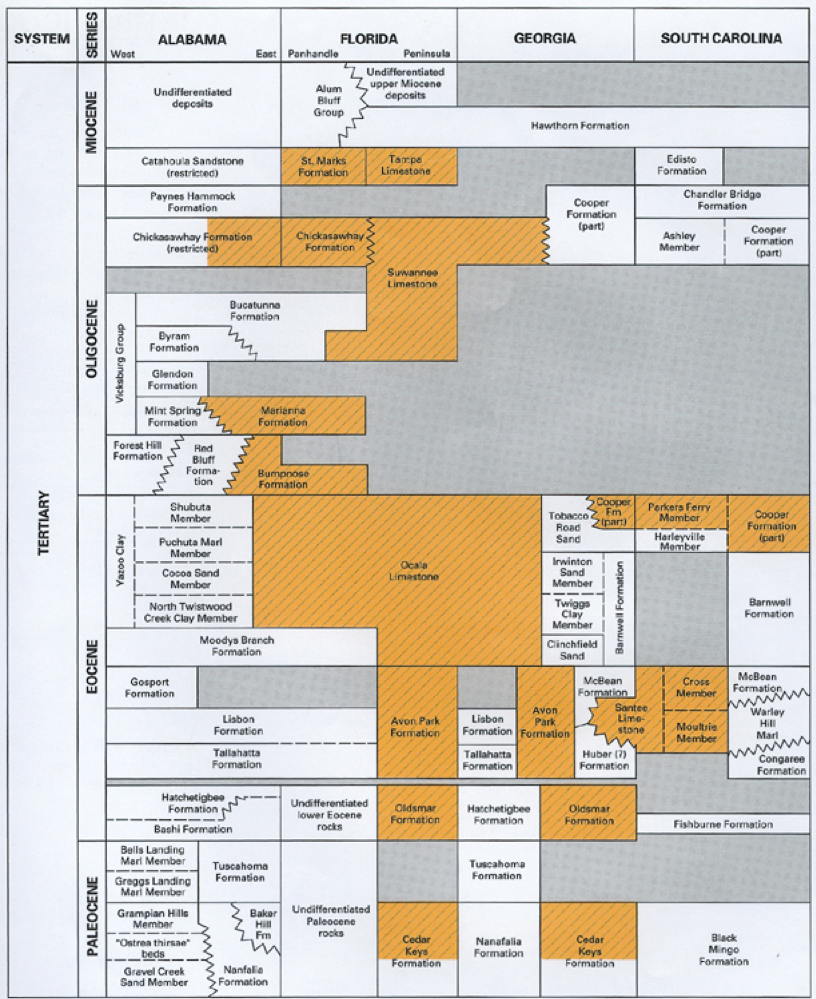
Figure 2. Stratified representation of geological formations comprising the Floridian aquifer system (Miller, 1990).
The Floridian aquifer is hydraulically connected through carbonate rock covering an area of roughly 100,000 square miles (Couch 1996). Regionally, groundwater flows from north to south although localized flows may fluctuate – especially with the influence of elevated withdrawal (Couch 1996). Transmissivities within the Floridian aquifer system are highly variable ranging from 2,000 to 1,300,000 feet squared per day. The Apalachicola River basin’s ‘complex hydrology’ along with the formation of conduits and solution openings through limestone dissolution account for the wide range of transmissivities (Couch, 1996).
The coastal plain providence of the Apalachicola River Basin is divided into 3 districts; the Marianna Lowlands District, the Tallahassee Hills District, and the Gulf Coastal Lowlands District (Coach et. al. 1996). The Marianna Lowlands (ML) are characterized primarily by relatively level/gently sloping landscape with cuesta topography (typical of a coastal plain) and Karst sinks/depressions formed from limestone dissolution. The Tallahassee Hills (TH) district is characterized by remnant hills (elevations up to 250ft) shaped by erosion and sand-hill ridges cut from dendritic drainage patterns. The ridges, composed of ‘clayey sand’ from the Miocene to Pleistocene, cover the subsurface limestone which ranges from 100 to 200 ft underground (Torack, 2006). The Gulf Coastal Lowlands (GC) are flat, sandy, composed of coastal sediments, near sea level, and have seaward sloping features. The GC district topography was shaped primarily by high sea levels and resulting currents/waves during the Pleistocene (Torack, 2006).
National disputes regarding the ACF basins water supply began in the 1980s, following several periods of drought and Atlanta’s growing demand subsequent to population growth (Ruhl, 2005). In 1990, after the Army Corps of Engineers decision to relocate 20% of water from Lake Lanier for Atlanta, Alabama sued the Corps for violated the state’s water rights (Lathrop, 2008). Both Florida and Georgia intervened an account of concerns raised regarding the environmental health of Apalachicola Bay, and management rights of Georgia as a sovereign state (Lathrop, 2008). In 1992 each state signed a Memorandum of Agreement delaying the litigation process in order to create the ACF River Compact; completed in 1997 (Lathrop, 2008). The compact established the ACF Basin Commission which aimed to form an agreement between the states regarding water allocation. On August 31, 2003 the compact expired as increasing demand of water in the ACF river for human consumption, irrigation, power generation, and environmental health downstream prevented any resolution to be reached (Lathrop, 2008). Ten years later Florida sued Georgia for over consumption of water harming the ecology, economy, biodiversity, and endangered species (such as oysters) by increasing salinity and the concentrations of pollutants (Robert, 2018). A Special Master was appointed and ruled in favor of Georgia, however, the court concluded the wrong standard was applied thus the case was re-opened. A second Special Master, Paul Kelly, Jr., was appointed in 2018 and has yet to finish the case report (Andreen, 2018).
The Apalachicola River basin is a highly ecologically productive watershed. The area hosts an estimated 1,300 species of plants, 40 species of amphibians, 80 species of reptiles, 131 species of fish, 300 species of birds, the highest density of amphibians and reptiles north of Mexico (Roberts 2008), and has the highest concentration of endangered and threatened species within the ACF basin (Ruhl, 2005). Low predation rates and high phytoplankton levels along with estuarine conditions at Apalachicola bay falling within a salinity of 10-22 ppt (salinity range for oysters) allows for a large oyster population. Consequently, the Apalachicola Bay supplies 90% of Florida’s oysters and 10% of all continental U.S. oysters (Lathrop, 2008). Oysters in the Bay also clean the water, filtering 20 to 50 gal/day thus allowing for increased biodiversity/tourism by actively preventing eutrophication/polluted water. The bay’s ecological success also positively impacts Florida’s economy earning a revenue of over $130 million/year (Lathrop, 2008).
Methods
A complete a water sample analysis of the Apalachicola River, Chattahoochee was completed in March 2019. General descriptions of wind speed/direction, water flow, GPS location, river velocity, weather conditions, and observed macrofauna were recorded. Two water samples were then collected at different locations within Chattahoochee. Using a YSI and test kits/strips, temperature, pH, TDS, conductivity, salinity, arsenic, phosphate, hardness, and sulfate measurements were calculated and recorded at each sample point. Velocity was estimated by calculating the time needed for a floating object (in this study a clementine was used) to travel a distance of 2 meters. USGS actual flow rate and water level were then recorded and analyzed further in the discussion.
Results
General descriptions of the Apalachicola River, Chattahoochee, including wind speed/direction (actual and estimated), air temperature, water flow, GPS location, and flow speed were measured. Estimated and actual wind direction was SW with an estimated speed of 3 mph and an actual speed 5 mph. The GPS location was measured to be 30°42’19.66″ N -84°50’44.66″ W and velocity (flow speed) was 0.03 m/s. This data is also partially represented in Table 1, below. The river was recorded to be generally still, slow, and flooded overall.
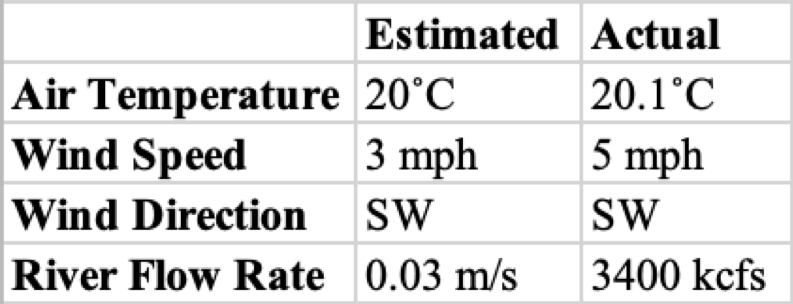
Table 1. Quantitative estimated and actual data representing general site-specific descriptions.
Two Water samples were taken at separate locations on the Apalachicola River, Chattahoochee. Using water analysis equipment (discussed in methods) both samples were tested for temperature, pH, TDS, conductivity, salinity, arsenic, phosphate, sulfate, and hardness. Resulting measurements for each sample can be seen in table 1, below.
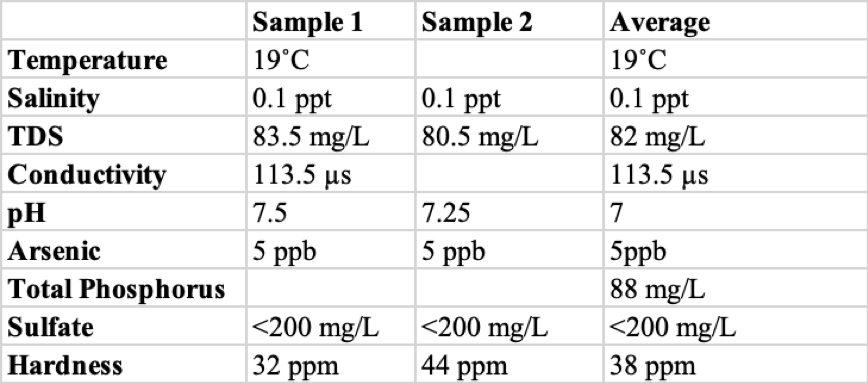
Table 2. Water quality data on the ACF basin at GPS position 30°42’19.66″ N -84°50’44.66″. Total phosphorous and average pH obtained from river data provided (experimental pH included in average).
Velocity of the river was then found by tracking a floating object over a specific distance. The object took 130 seconds to travel 4 meters and velocity was calculated to be 0.03 m/s. The USGS actual flow rate on March 11, 2019 was 3400 kcfs and its water level was above normal levels at 52.3 ft. Raised water levels typically result in an increase in volume of water within the river and a subsequent shift in sediment/mineral composition, and water quality away from data seen at average levels. Thus the water quality, core sampling, and physical parameters displayed in Table 1 (above) reflect characteristics of a flooded river.
Discussion
High levels of historic ecological productivity and biodiversity in the Apalachicola River basin resulted from an average neutral pH, river nutrients, and salinity values ranging from 0.10 to 0.22 ppt. These values allowed for large oyster populations which filter the water thus promoting other local marine organisms, tourism, and Florida’s economy (Lathrop, 2008). Continuously increasing withdrawals and ground/surface water loss from the ACF River have consequently caused a change in water quality/composition downstream, specifically in the Apalachicola Bay. Such changes include increases in salinity and pollutant concentrations (resulting from freshwater depletion) resulting in loss of oyster populations and ensuing degradation of the bay’s environment/ecology (Robert, 2018). Experimental values found in this study (Table 1), especially those that stray from such trends, may have errors resulting in skewed data from flooded river levels.
Works Cited:
Andreen, W. L. (2018). Florida v. Georgia: The Supreme Court weighs in on the struggle over the Appalachicola-Chattahoochee-Flint river basin. Trends, 50(3). Retrieved April 11, 2019, from https://www.americanbar.org/groups/environment_energy_resources/publi cations/trends/2 018-2019/january-february-2019/florida-vs-georgia-supreme-court/
Couch, C. A., Hopkins, E. H., & Hardy, P. S. (1996). Influences of environmental settings on aquatic ecosystems in the Apalachicola-Chattahoochee-Flint River Basin. Water-Resources Investigations Report, 95, 4278.
Florida Department of Environmental Protection (Ed.). (n.d.). National Estuarine Research Reserves – Apalachicola. Retrieved April 11, 2019, from https://floridadep.gov/rcp/nerr-apalachicola
Lathrop, A. S. (2008). A tale of three states: Equitable apportionment of the Apalachicola-Chattahoochee-Flint river basin. Fla. St. UL Rev., 36, 865.Lathrop, A. S. (2008). A tale of three states: Equitable apportionment of the Apalachicola-
Livingston, R. J. (1991). Historical relationships between research and resource management in the Apalachicola River estuary. Ecological Applications, 1(4), 361-382.
Livingston, R. J., & Joyce Jr, E. A. (1977). Proceedings of the Conference on the Apalachicola Drainage System.
Miller, J. A. (1990). Ground Water Atlas of the United States Alabama, Florida, Georgia, and South Carolina (HA 730-G). US Geological Survey. Available: http://pubs. usgs.gov/ha/ha730/ch_g/G-text6. html.
Roberts, D. (2018). “Veiled in Emerald”: Apalachicola Ecology. Southern Cultures, (1), 7. Retrieved from http://search.ebscohost.com.proxy.lib.fsu.edu/login.aspx?direct=true& db=edsglr&AN=edsgcl.537981899&site=eds-live&scope=site
Ruhl, J. B. (2005). Water wars, eastern style: divvying up the Apalachicola-Chattahoochee-Flint River Basin. Journal of Contemporary Water Research & Education, (131).
Torak, L. J., & Painter, J. A. (2006). Geohydrology of the lower Apalachicola-Chattahoochee-Flint River basin, southwestern Georgia, northwestern Florida, and southeastern Alabama(No. 2006-5070).
.
Hi, this is a comment.
To get started with moderating, editing, and deleting comments, please visit the Comments screen in the dashboard.
Commenter avatars come from Gravatar.